Tsunami Inundation Areas
UPDATE: San Mateo County has released a new, Tsunami Hazard Area Dashboard indicating worst case scenario regions of concern. The map is developed based on the data from the California Department of Conservation Evacuation Map. It identifies the hazard area boundary limits using a tsunami event model with an average return period of 975 years, and expands to account for potential local sources and to align with natural geographic features or city street layouts.
As a follow up to yesterday’s short lived tsunami warning you may have been asking; What are the designated “coastal areas” or low lying areas of concern when there is a tsunami?
In 1964 a magnitude 9.2 earthquake off of Alaska sent a powerful wave, cresting at 21 feet, into Crescent City in the most damaging tsunami in California history. Since then, geologists have put together maps estimating the maximum, worst case flooding taking into account the effect of combined king tides, storm surge and earthquake generated waves. The map for San Mateo county is available through the public, planning, GIS portal at https://gis.smcgov.org/apps/publicviewer/
In “LAYERS” select “HAZARDS” and check the box “Tsunami and Seiche Inundation Areas” to overlay the areas of concern.
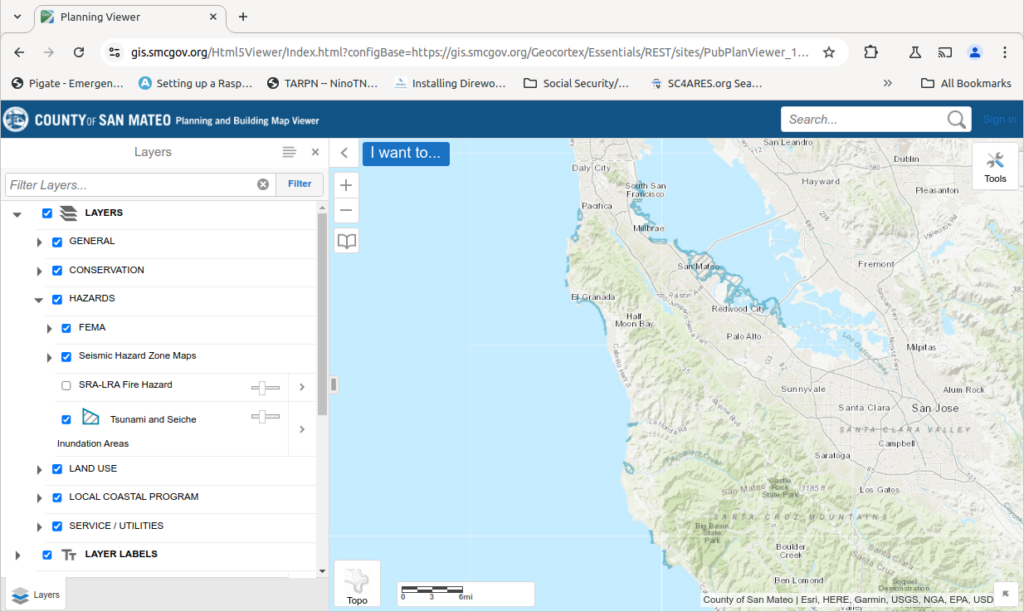
You can scroll around and zoom for a better view. Most areas are right on the water, but a couple of low lying areas extend inland. Check it out now and be prepared for the next big earthquake.